Analyze Extreme Distributions in Postgresql

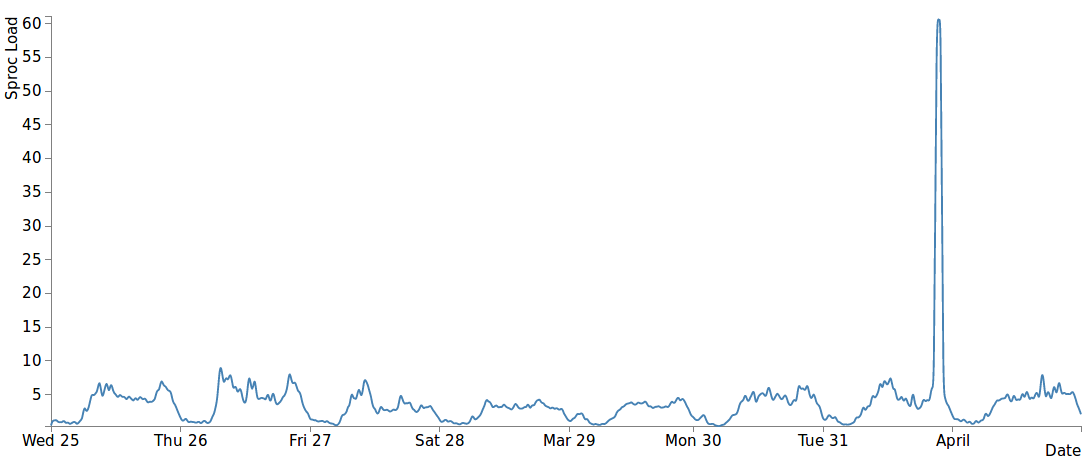
Recently my team and I observed in our PostgreSQL databases a sporadic increase
in the execution time of stored procedures (see the graph above). Often it
happened that an analyze of the referenced table solved the issue. In our case,
fluctuations in our execution plan caused statement timeouts. This led to errors
in our applications.
We wanted to understand this behavior better. Which circumstances prompted more frequent plan fluctuations? How exactly could we influence the system to be more reliable? To find answers, we tested how different configurations of PostgreSQL influenced the results of the query planner. This post shares the results of our tests.
One of the query planner’s strengths is that it enables PostgreSQL to use statistics about the distribution of your data in the database tables to decide which of the various possible execution plans is the cheapest. The database system regularly runs analyze commands to update those statistics. In order to keep the costs of this operation low with respect to time and the space required for storing those data, analyze takes a limited, random sample of the table.
The reliability of the statistical information about your data distribution depends on the ratio of the size of the sample taken to the size of the entire table. As the PostgreSQL documentation already states, this might lead to less-than-optimal query plans.
A database user can query the pg_stats view to examine the data processed by the
query planner. pg_stats view offers a number of attributes for each column of
every table. For instance, it shows the fraction of null values in a column, or
the correlation between the physical and logical ordering of rows (see
documentation for more information). For non-unique columns, it shows the most
common values with their frequencies and histogram boundaries for all other
values. The histogram boundaries split the range of values into buckets of equal
size. Given the number of rows and the number of buckets, the query planner can
calculate the selectivity of a given attribute. With histogram buckets, we can
properly deal with the uniform distribution of data in our tables.
PostgreSQL also addresses non-uniform distributions. The sum of portions represented by the histogram does not include fractions of the most common values. This allows PostgreSQL to make more precise estimations. It also allows the query planner to avoid index scans for any query that affects a big portion of the rows on an indexed predicate.
The default statistics target parameter defines how many values are to be stored in the list of most common values, and also indicates the number of rows to be inspected (the value of this parameter, multiplied by 300). This statistics target defaults to 100, which means that PostgreSQL will inspect the maximum of 30,000 rows.
We can use this pg_stats view to investigate which values would change in the event of a fluctuating execution plan. Database applications often use a status field such as NEW, PROCESSING, or DONE to mark the processing status of a row. This results in a typical distribution of the status field values: a small set of new rows to be processed (NEW), some rows already being processed (PROCESSING), and a large number of rows remaining in their final state (DONE). In a constantly growing table, rows of unprocessed states represent a constantly decreasing portion of the table.
To understand in which cases those query plans happen to flip, we created a table with test data that differ in their distribution. We chose four different values to represent the status of the real data. In different columns of our test table, we generated different distributions of the status. In this set of test columns, the fraction of the NEW status decreases from 1 per 2700 rows to 1 per 286,000 rows.
Here’s what some values from pg_stats view look like for one column of our test
table after we execute analyze:
─[ RECORD 1 ]─────┬──────────────────────────────
attname           │ log4_fewval
most_common_vals  │ {3,2,1}
most_common_freqs │ {0.8978,0.101233,0.000966667}
histogram_bounds  │
Given that this log4_fewval column is indexed, and that we want to fetch rows
with the least frequent values, we get the following execution plan:
local_test_db=# explain select count(1) from sli_stat_testdata where log4_fewval = 0;
                                                      QUERY PLAN
──────────────────────────────────────────────────────────────────────────────────────────────────────────────────────
 Aggregate  (cost=5.59..5.60 rows=1 width=0)
   ->  Index Only Scan using sli_stat_testdata_log4_fewval_idx on sli_stat_testdata  (cost=0.43..5.58 rows=1 width=0)
         Index Cond: (log4_fewval = 0)
(3 rows)
If we repeat the analyze, we might come up with the following result from pg_stats.
─[ RECORD 1 ]─────┬────────────
attname           │ log4_fewval
most_common_vals  │ {3}
most_common_freqs │ {0.898933}
histogram_bounds  │ {0,2,2}
The execution plan for our query also changes:
local_test_db=# explain select count(1) from sli_stat_testdata where log4_fewval = 0;
                                                  QUERY PLAN
──────────────────────────────────────────────────────────────────────────────────────────────────────────────
 Aggregate  (cost=104657.96..104657.97 rows=1 width=0)
   ->  Bitmap Heap Scan on sli_stat_testdata  (cost=6218.30..103827.68 rows=332111 width=0)
         Recheck Cond: (log4_fewval = 0)
         ->  Bitmap Index Scan on sli_stat_testdata_log4_fewval_idx  (cost=0.00..6135.27 rows=332111 width=0)
               Index Cond: (log4_fewval = 0)
(5 rows)
The estimated costs are 20,000 times higher!
In the first case, the value 0 was represented neither in the list of most common values nor in histogram bounds. As we can see in the execution plan, the planner assumed that our WHERE clause will affect 1 row. In the second example, the histogram bounds array represents our value of interest. This means that more than 10% of the rows have values between 0 and 2. Because there are only two buckets, every bucket represents almost 5% of the data. The query planner has to assume more than 2.5% of the rows have the value 0 (rows=332.111). This is way more than the real 98 rows.
The query planner overestimated the amount of data affected by this query. This caused the planner to do a Bitmap Heap Scan and re-check of the filter condition. In addition to the estimated larger number of rows, the execution reexamined all rows in those pages, further slowing it down. That’s why we finally encountered the statement timeout.
Ideally, all four status values are found in the list of most common values (MCV), since the default statistics target of 100 should give us up to 100 different values. Due to the small sample size, some of the values were not seen during analyze, which led to wrong statistics. If the analyze process misses some of the rare values, it has no data to estimate the distribution of those rare values. For our use case, that means: If not all of the distinct values of our status are represented in the list of most common values, Postgres assumes that those values are distributed uniformly.
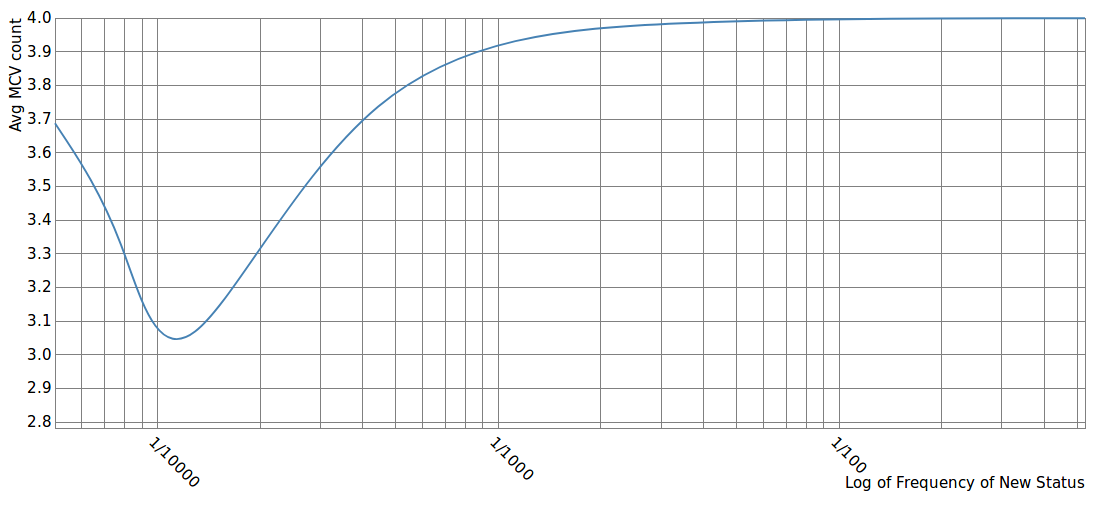
We have tested for different distributions how often all four different values
are represented in the MCV list. The following diagram shows that, down to a
frequency of 0.04%, all values are represented in the MCV list. The more we
continue decreasing the frequency of the status 0 value, the more we miss it in
the MCV list in our pg_stats view. In the extreme case that there is no row for
status 0, the average will be 3.

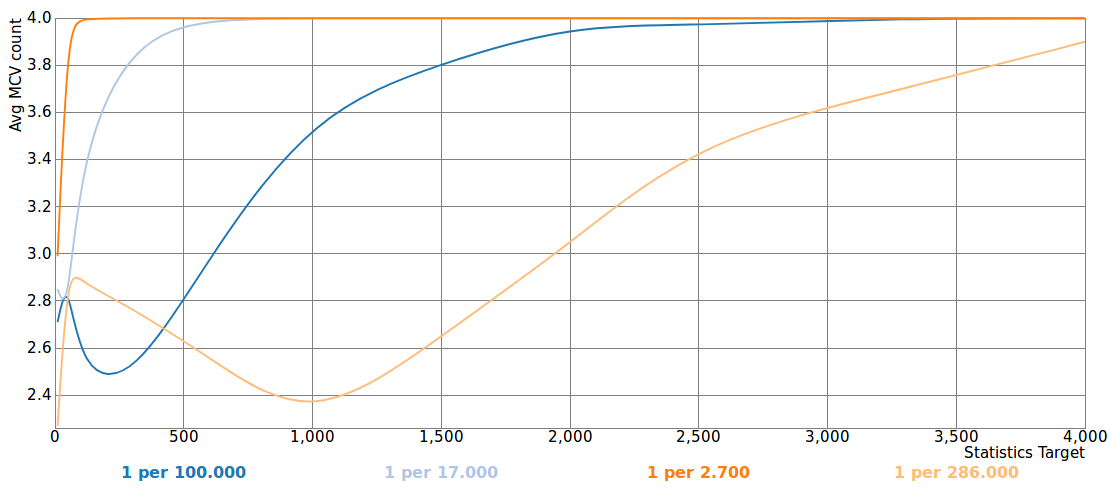
The administrator can address this issue by adjusting the statistics target for the table. This raises the question: To which value do we have to adjust the statistics target for this column?
We’ve tried out the percentage of rows the analyze has to inspect so that all distinct values are represented in the MCV list. The following diagram shows, for different distributions, from which statistics target we reach repletion in the MCV list.

In some cases it may make things worse if we do not drastically increase the statistics target. In the case “1 per 286,000,” for example, we did not achieve repletion even when we inspected 12% of the rows. In those cases it might be better to archive data, so the fraction of these new rows will remain on a higher level.
In many cases, the standard configuration of PostgreSQL analyze works very
well. If tables grow larger than several million records, you must examine the
distribution of your data. In any case, increasing the statistics targets can
only mitigate those issues. Uncertainty will remain, because the approach is
statistical. We can adjust the probability in our favor.
From this analysis, we learned to which precise values we had to adjust the configuration. Since then, our application runs stably without the previous observed statement timeouts.