An Update on Statistics Target
In an earlier article I analyzed the influence of the statistics target on the result of sampling for extreme distributions. The representation of extreme rare values in the most common values required a drastic increase of the sample size.
My colleage Alex Shulgin initiated a patch which improved the situation for
null values. In PostgreSQL 9.6 the improvements for analyze were released.
More work was done on this issue later to improve the selection of most common
values which was released in PostgreSQL 11.
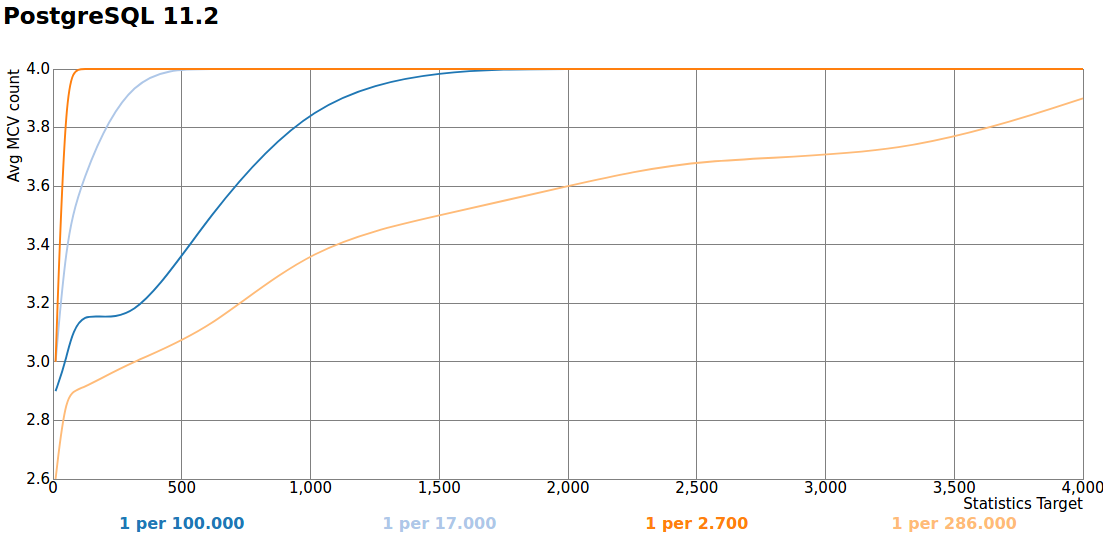
I was curious how the situation has changed. Which values for the statistics
target should I choose in a similar situation? So I repeated the analysis with
a newer version of Postgres. Below you find the results for PostgeSQL 11.2 (10
Mio rows, 10 samples for analyze).

Now the graphs are monotonic. What an achievement!